Home /
Expert Answers /
Statistics and Probability /
the-following-data-represent-the-high-temperature-distribution-for-a-summer-month-in-a-city-for-some-pa875
(Solved): The following data represent the high-temperature distribution for a summer month in a city for some ...
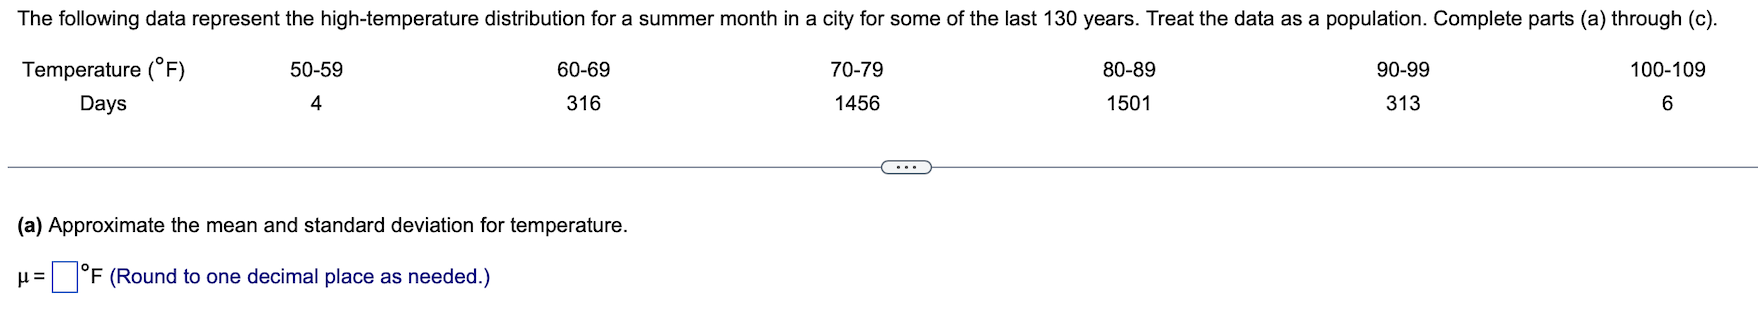
The following data represent the high-temperature distribution for a summer month in a city for some of the last 130 years. Treat the data as a population. Complete parts (a) through (c).
(a) Approximate the mean and standard deviation for temperature.
\mu =, 'F (Round to one decimal place as needed.) The following data represent the high-temperature distribution for a summer month in a city for some of the last
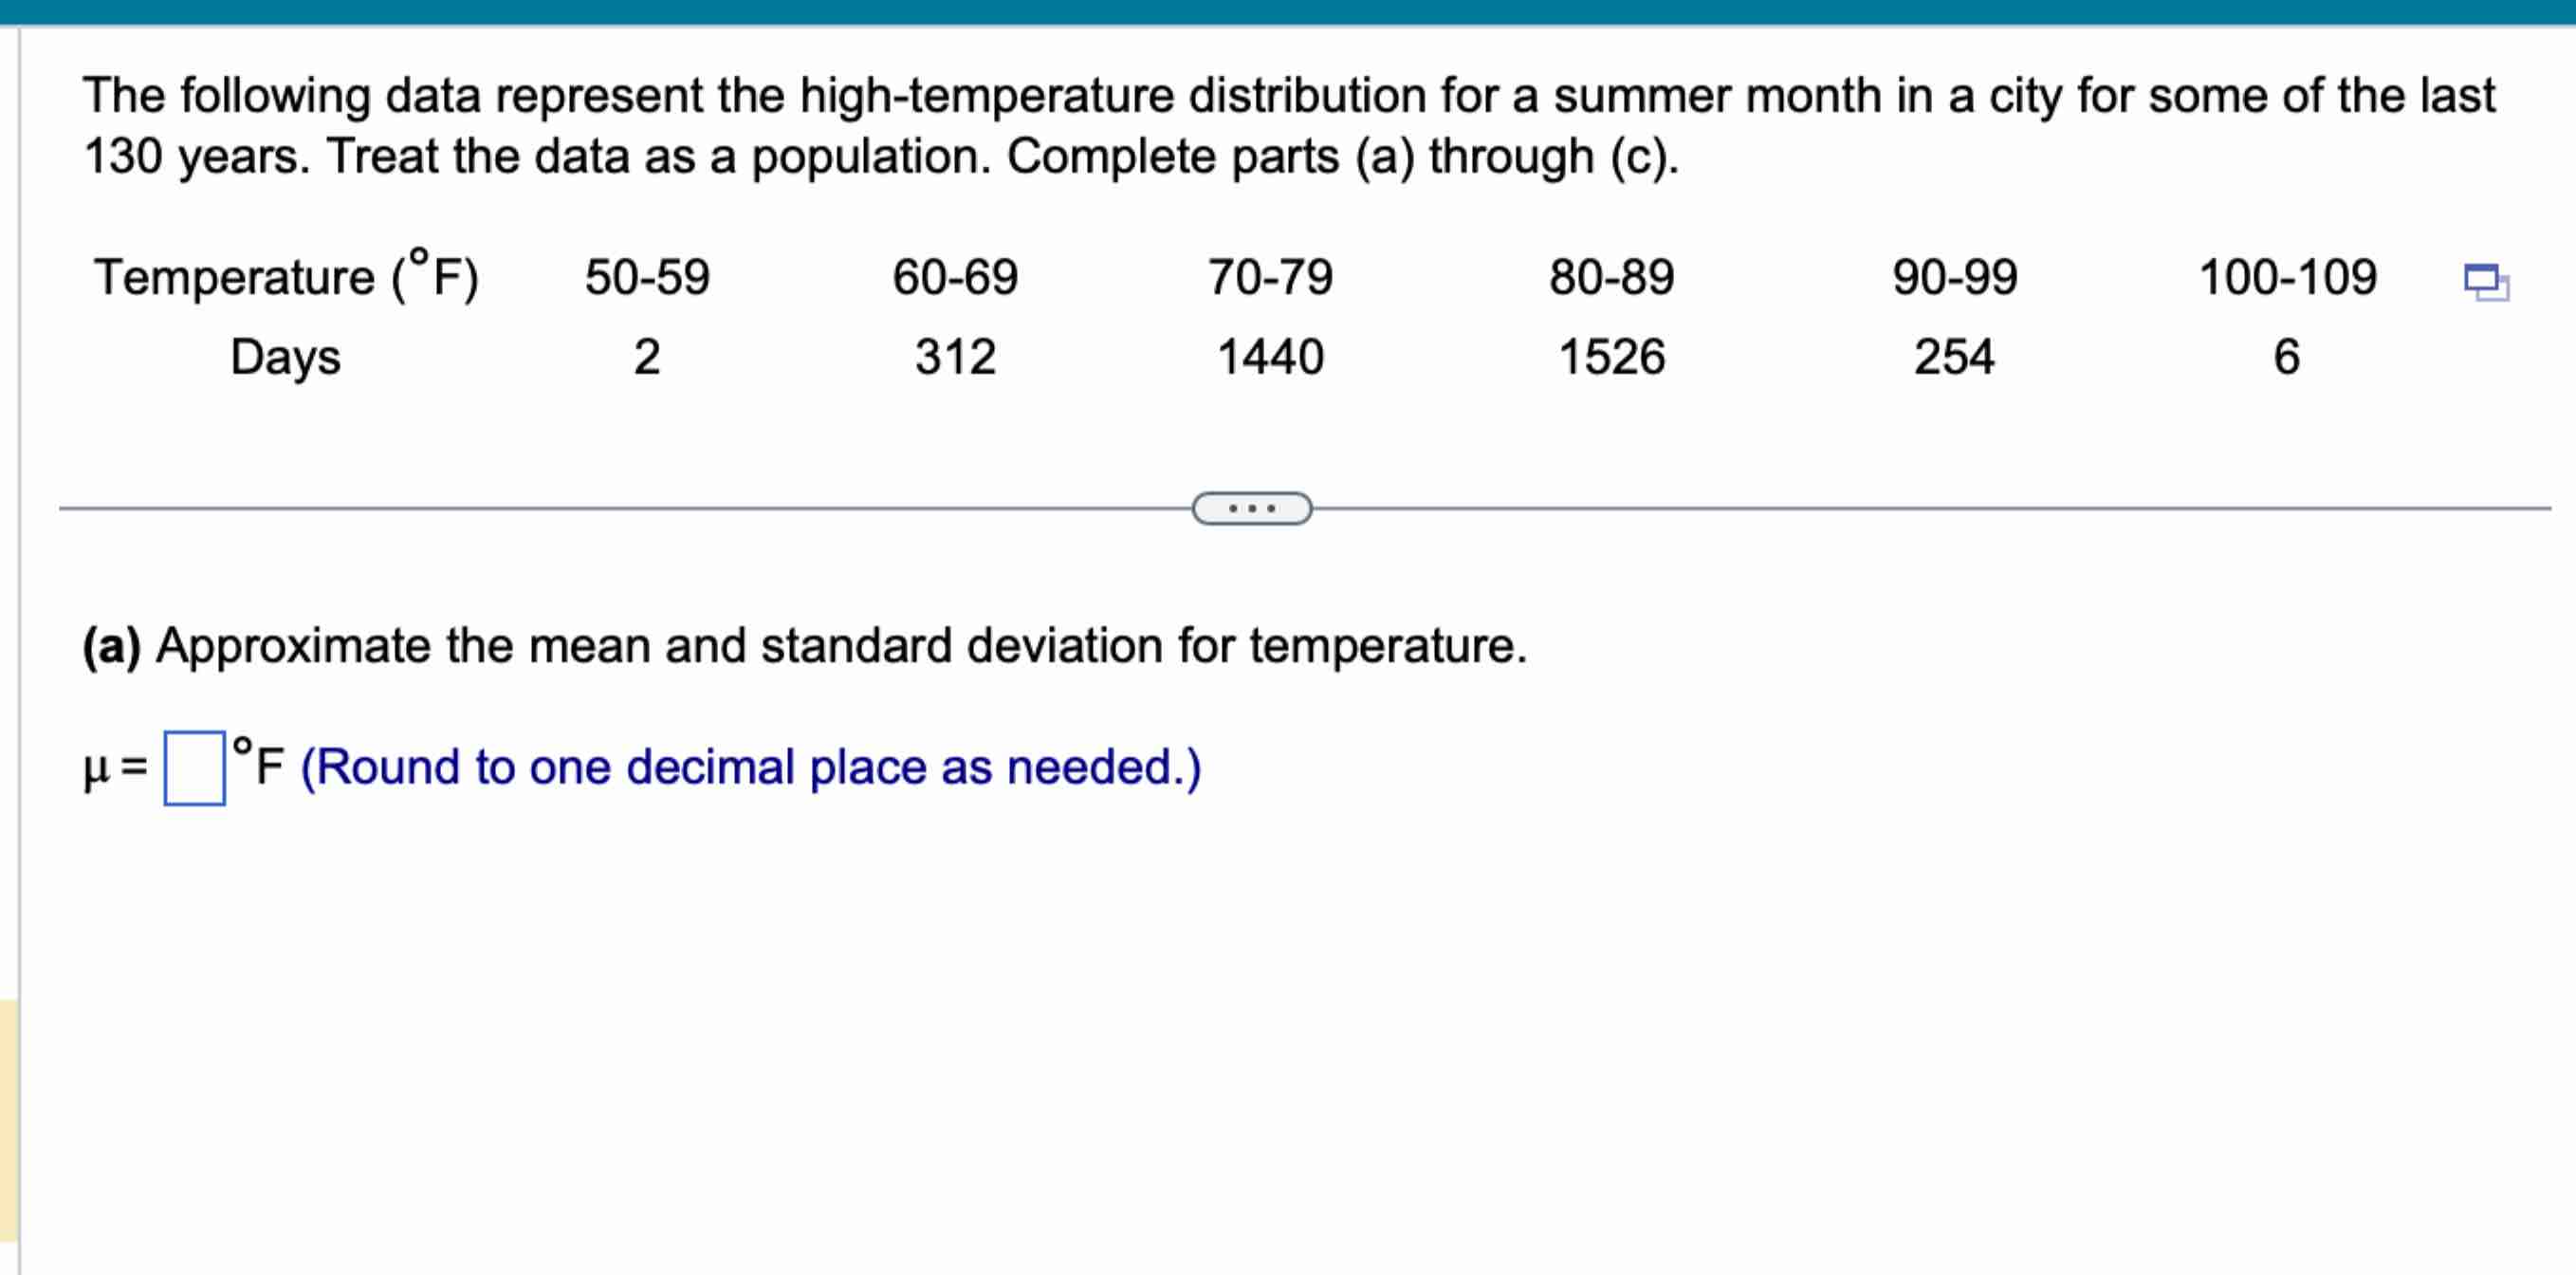
130 years. Treat the data as a population. Complete parts (a) through (c).
(a) Approximate the mean and standard deviation for temperature.
\mu =,\deg F (Round to one decimal place as needed.)